June 2026 REPORT
A Warmer Labor Market Means Workers Move by Choice
Key findings:
- Employees working +2.5%, hours worked +2.4%, stronger early-summer lift than 2025 (+1.9%) and matching 2024's pace.
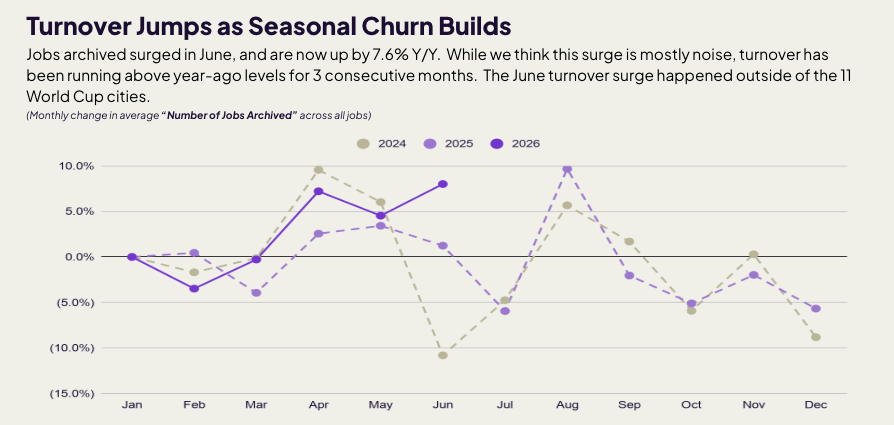
- Turnover jumped +8.0% month-over-month vs. only +1.2% last year.
- Entertainment surged +26.4%, Hospitality +9.5%, showing summer is landing hardest in experience/leisure sectors.
September 2025 REPORT
Main Street Holds Steady as Seasonal Contraction Continues
Key findings:
- Employee participation fell -3.6% and hours worked -4.7%, reflecting the typical late-summer pullback.
- Entertainment (-21.4%) and Hospitality (-10.7%) drove industry losses; Medical/Veterinary ticked up slightly.
- Wages rose across all sectors, now nearly 40% higher than early 2022.
- Hiring eased after August’s surge, while turnover stayed elevated compared to 2024 levels.
Download All Reports
Check out the stats and insights sourced from 100K+ small businesses.
Explore our data reports library:
May 2026 Report
Main Street is gearing up for summer by adding hours, not headcount. Employees working rose just 0.2% m/m while hours worked climbed 1.2%, and hiring ramped 6.6% even as jobs added per location stayed below last year. Wage growth cooled to 5.9%. The result is a busy but cautious Main Street, with the recovery concentrated in summer-leisure sectors while everyday services contract.
.jpg)
April 2026 Report
Employees working dipped 0.2% m/m, the first negative March-to-April reading in three years, as Sun Belt business openings fell sharply (Southwest -2.1%, West -2.0%), reversing the cautious optimism of March's three-year hiring high.
.jpg)
March 2026 Report
Main Street is seeing a cautious spring rebound, with hiring momentum returning even as overall activity remains uneven. Businesses are adding staff more confidently, but broader demand signals suggest a slower, more measured recovery taking shape.

February 2026
Main Street labor conditions steadied in February, with modest improvements following early-year softness. While growth remains subdued compared to prior years, falling turnover and measured hiring suggest small businesses are prioritizing stability over aggressive expansion.

January 2026
Main Street labor conditions stabilized after the holiday reset, with workforce participation and hours worked tracking last year’s levels. Despite brief weather-related disruptions, sector trends improved and hiring and turnover showed signs of normalization heading into 2026.
December 2025
Main Street labor conditions weakened further in December as year-end softness deepened. Employees Working fell 0.9% and Hours Worked declined 0.6%, extending November’s sharp pullback. Discretionary industries, led by Hospitality, saw the largest contractions, while Caregiving remained resilient and Retail held steady. Wage growth continued even as hiring and turnover slowed into year-end.
November 2025 Report
Main Street activity cooled further as seasonal slowdown intensified. Workforce participation fell 2.7% and hours worked dropped 3.1%, marking the steepest declines in three years. Entertainment and Hospitality saw the sharpest pullbacks, while most other sectors softened. Wage growth persisted but at a slower pace, with Health Care and Professional Services the few exceptions. Hiring remained weak after earlier over-staffing, and turnover edged up slightly but stayed well below summer peaks.

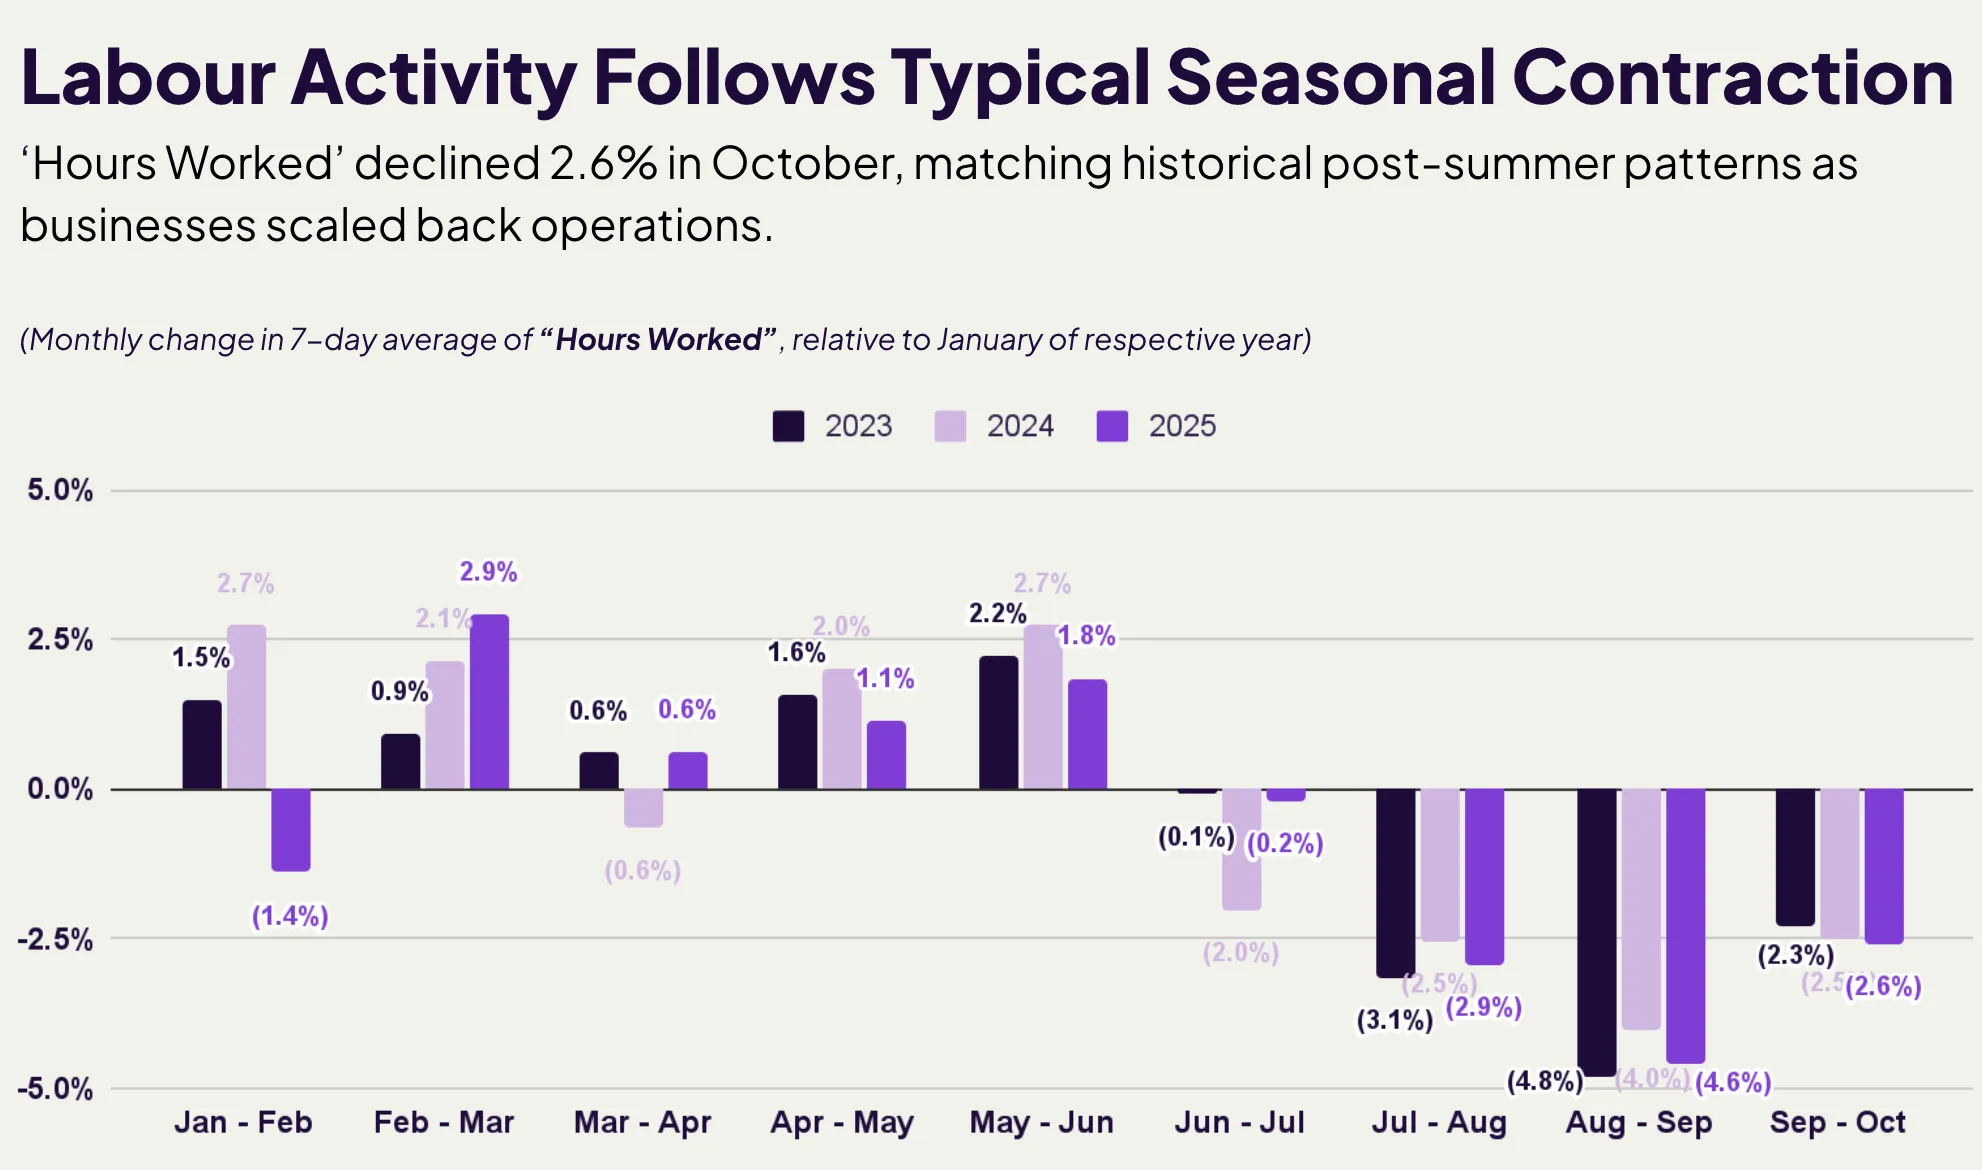
October 2025
Main Street businesses continued to cool in October as seasonal trends persisted. Workforce participation slipped 2.9% and hours worked fell 2.6%, reflecting a typical post-summer slowdown. The Southeast was the only region to hold steady, while Entertainment saw the sharpest industry contraction and Hospitality remained resilient. Despite slower activity, wages climbed 42% above early 2022 levels, and labor turnover stayed elevated even as hiring eased.

September 2025 Report
Employee activity slipped in September as Main Street businesses navigated a deeper seasonal slowdown. The Northeast and Midwest led regional declines, while Entertainment and Hospitality saw sharp seasonal pullbacks. Despite softer hiring and elevated turnover, wages rose across all sectors, pushing costs nearly 40% above pre-2022 levels.

August 2025 Report
Employee activity fell sharply in August, matching seasonal patterns. Entertainment, Caregiving, and Home & Repair saw steep drops, while turnover spiked to a multi-year high. Increased hiring pointed to widespread backfilling, not expansion.
July 2025 Report
Employee activity declined in July amid typical mid-summer slowdown, though losses were milder than in 2024. Entertainment and hospitality led industry gains, while personal services and retail continued to lag. Wage growth persisted despite sharp hiring cuts, as businesses prioritized retention.

June 2025 Report
Employee activity rose in June but remained below prior-year levels, reflecting a slower seasonal ramp. Entertainment and Home & Repair led industry gains, though momentum softened from past summers.
May 2025 Report
Workforce engagement and employee activity held steady in April, following seasonal hiring trends seen in past years.
April 2025 Report
Workforce engagement held steady, Entertainment and Home & Repair led hiring, and Midwest/Northeast saw business growth. Wages rose modestly as labor costs increased.

March 2025 Report
Employee activity rose above previous years, with strong growth in Entertainment and Home & Repair. Midwest and Northeast led regional gains. Wages stabilized, with retail seeing a slight boost.
December 2024 Report
Employee activity dipped slightly, while retail and caregiving saw holiday boosts. Wages increased modestly. Turnover and hiring dropped as SMBs maintained steady rosters through season’s end.

November 2024 Report
Retail and Food & Drink drove wage growth. Holiday staffing drove upticks in hiring and turnover. Beauty & Wellness and Medical & Veterinary led industry growth amid Southeast’s rebound.
October 2024 Report
Employee activity slowed across most regions. Hurricanes hurt the Southeast, while Entertainment saw a sharper decline than usual. Hospitality posted a small gain. Wages and rosters stayed flat.
September 2024 Report
Workforce activity softened but was stronger than last year. Midwest and Northeast experienced weather-related dips. Hourly wages rose steadily, while hiring and turnover flattened after August.
August 2024 Report
Employee activity and hours worked declined across all regions. Entertainment saw the sharpest drop as schools reopened. Meanwhile, wages rose across all sectors, driving up labor costs.
July 2024 Report
Employee activity hit a three-year low, with the Southwest hardest hit. Entertainment and Hospitality performed best among slowing industries.