
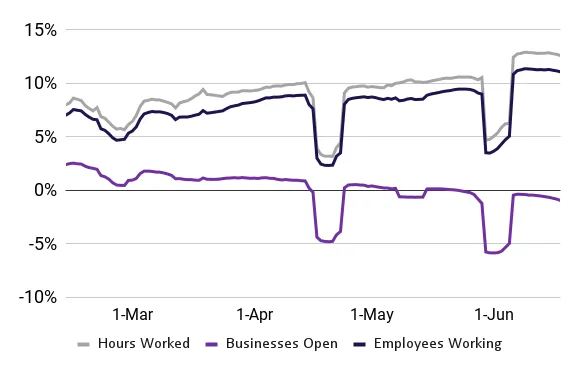
Main Street remains resilient despite macroeconomic and geopolitical challenges. Our key Main Street Health Metrics — hours worked and employees working — are up compared to January of 2022. Data from mid-June remains consistent with data from mid-May with a bias to the upside. Overall, performance in our key metrics remain consistent with trends observed in the pre-Covid period.
Main Street Health Metrics (Rolling 7-day average; relative to Jan. 2022)
Employees Working1 (Rolling 7-day average; relative to Jan. of reported year)
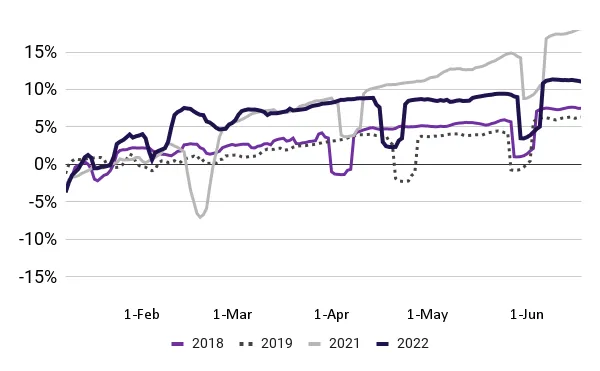
- Some significant dips due to major U.S. holidays. Pronounced dip in mid-February 2021 coincides with the period including the Texas power crisis and severe weather in the Midwest. Source: Homebase data.
Regional differences
National trends in our key Main Street Health metrics mask some differences across regions, states and MSAs. For example, our hours worked metric showed continued strength in New England, The Plains, Great Lakes, and the mid-Atlantic regions. The Rocky Mountains, in turn, surged in terms of employees working (from a reading of 1.1% in mid-May to 7% in mid-June).
Percent Change in Hours Worked (Mid-June vs. mid-May using Jan. 2022 baseline)
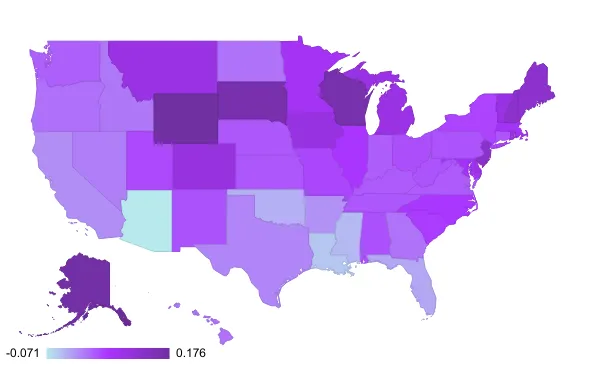
- June 12-18 vs. May 8-14. Hours worked is calculated from hours recorded in Homebase timecards and reflects the percentage of employees working in a given period relative to the baseline reference period.
Entertainment and hospitality continue to significantly outperform compared with the beginning of 2022. In terms of industry performance differences in the percentage of employees working, mid-June 2022 resembled the corresponding period in the pre-Covid year of 2019. Entertainment (+21%) and hospitality (+13%) surged in June. Beauty & wellness (+7%) and retail (+3%) rebounded relative to mid-May of this year.
Percent Change in Employees Working for Select Industries (Compared to January 2022 baseline using 7-day rolling average)
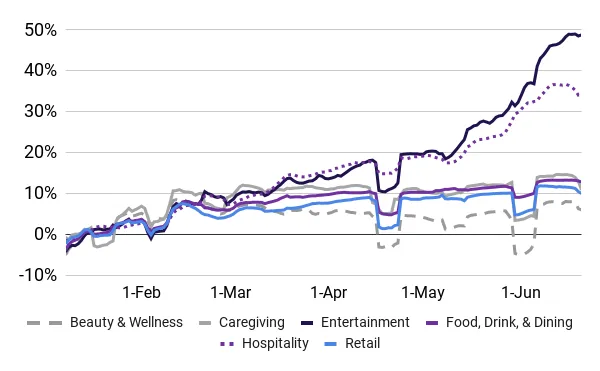
1. Pronounced dips generally coincide with major US Holidays. Source: Homebase data
Nominal average hourly wages are up almost 10% since the beginning of 2021. Average (nominal) hourly wages in mid-June remained approximately 10% above estimates from January of 2021. However, evidence from mid-June suggests that wage inflation has moderated month-over-month.
Percent Change in Nominal Average Hourly Wages Relative to January 2021
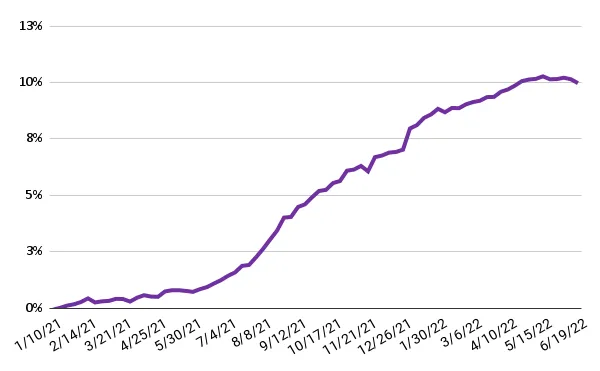
1. Nominal average hourly wage changes calculated relative to January 2021 baseline. .Source: Homebase data
Guy Berger is a macroeconomist specializing in US labor markets, passionate about helping small business owners understand what’s happening in the job market. He currently serves as Senior Advisor on Labor Markets at Access/Macro and Workforce Economist in Residence at Guild. Previously Principal Economist at LinkedIn, Guy's commentary has been featured in the New York Times, Wall Street Journal, and Bloomberg. He holds a doctorate in economics from Yale.

Guy Berger is a macroeconomist specializing in US labor markets, passionate about helping small business owners understand what’s happening in the job market. He currently serves as Senior Advisor on Labor Markets at Access/Macro and Workforce Economist in Residence at Guild. Previously Principal Economist at LinkedIn, Guy's commentary has been featured in the New York Times, Wall Street Journal, and Bloomberg. He holds a doctorate in economics from Yale.